A big sized js libraries bundle is never good for the user experience. A major problem being the download time as it increases the wait time for the application to get ready.
Another issue that it causes is a bigger overhead in execution time during initialization.
Today we will look at a few ways to investigate our bundle size and the probable factors that might be increasing its size unnecessarily.
Webpack Bundle Analyzer
First up, we have a webpack plugin - webpack-bundle-analyzer.
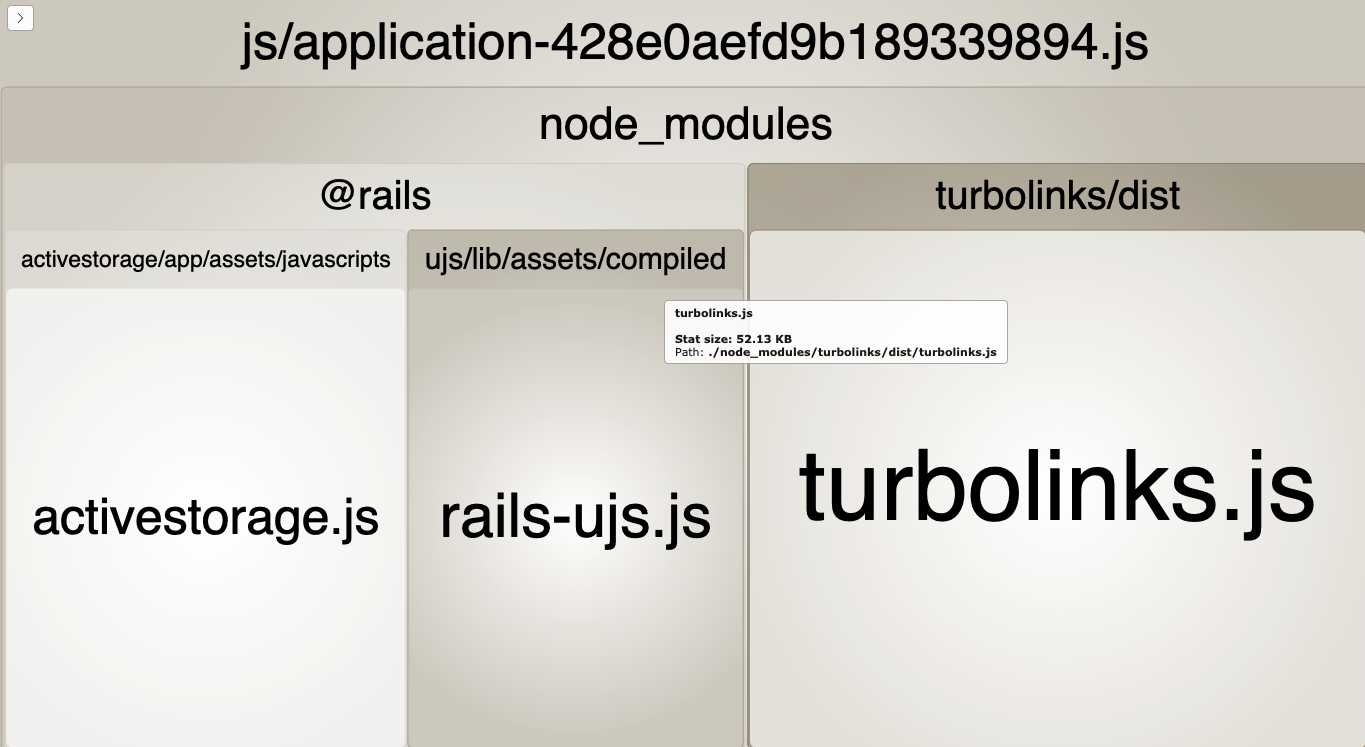
This is a visual tool to see which components are contributing the most to the size of our bundle. It uses the webpack stats JSON file to provide us with an interactive treemap visualization of the contents of our bundle.
Let us see how to use this tool in our application.
Adding the plugin
$ yarn add -D webpack-bundle-analyzer

# or if using npm

$ npm i webpack-bundle-analyzer --save-dev
Creating the webpack stats JSON file
# creates stats.json in current directory
$ webpack --json > stats.json

# or if using with Rails, give a path to webpack config
$ npx webpack --config config/webpack/development.js --json > stats.json
Using the Analyzer
$ yarn webpack-bundle-analyzer stats.json

Webpack Bundle Analyzer is started at http://127.0.0.1:8888
Use Ctrl+C to close it
The above command should start a server on http://127.0.0.1:8888 where the visualization can be seen.
 Webpack bundle analyzer visualization
Analyzing the result
-
Upon hover of any tile, we see stat(size before minification or compression), parsed(output size) and gzip(size after compression) sizes in the tooltip.
-
We could also filter the result to show only matched modules. They show up in red.
Webpack Visualizer
Continuing in the series of available analyzers, we have a visual tool - Webpack Visualizer.
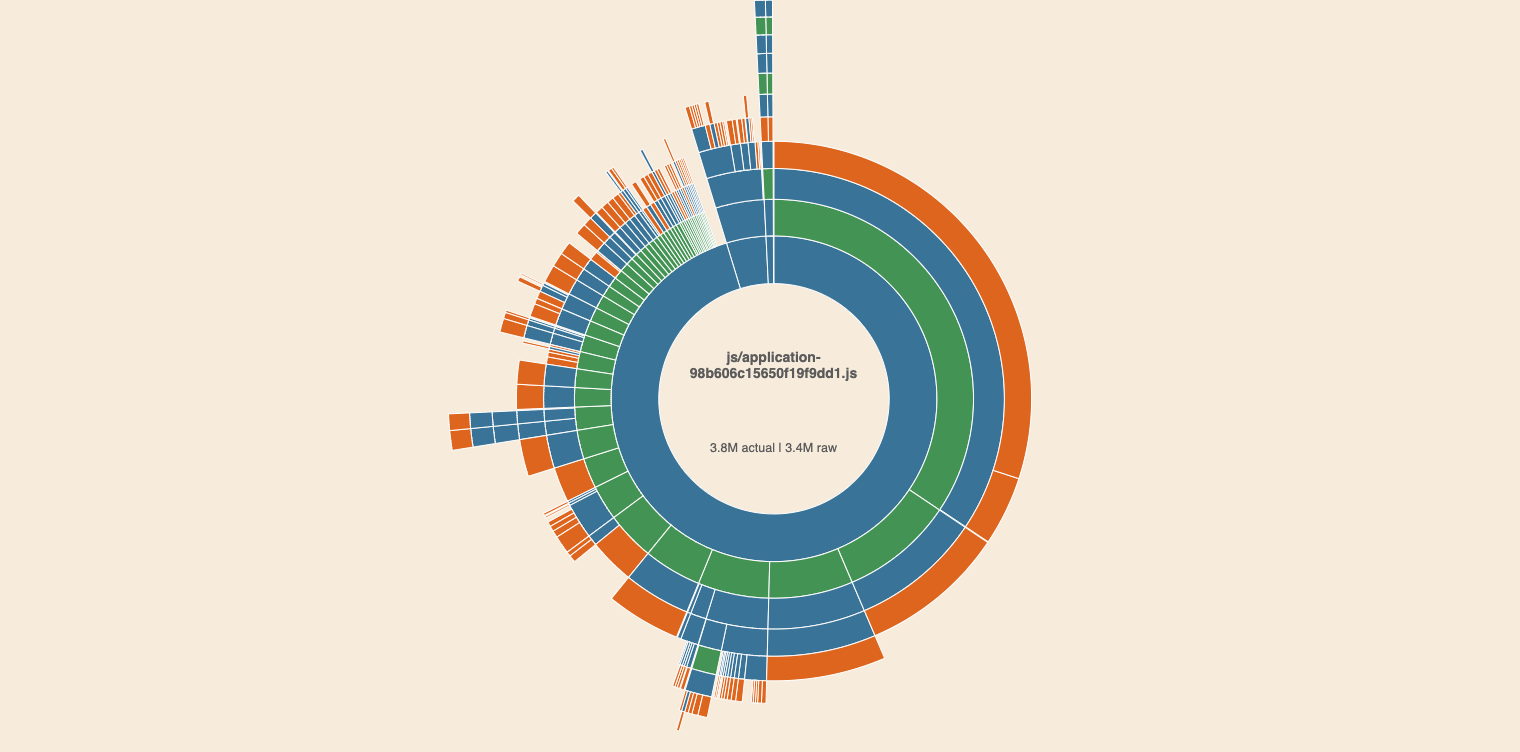
This tool can be used for detecting modules that are taking up a lot of space and ones which are duplicates.
Using the Visualizer
Referring to the section above, we need to create a stats.json file in our project.
Then we can upload that file to this site. This will provide a visual bifurcation of our modules and how much space they are taking along with their percentage contribution to the total size of the chunk.
 Webpack Visualizer
Analyzing the tool
-
We get a nifty dropdown on the top left portion of the result page where we can select which chunk we want to analyze.
-
Upon hover of any module, we can see the actual size, the raw size and the percentage to the chunk size.
-
The hierarchy is defined by the concentric rank of the circle where the module resides. For example,
node_moduleswould be on a very inner circle and anything that resides insidenode_moduleswould be in an outer circle.
Bundlephobia
Moving away from the bundle analyzers, we have a tool which allows us to check details about a new plugin before adding it to our project - Bundlephobia.
Whenever we require functionality for which we want to introduce a new plugin, we can use this website to check the size of the plugin first and choose a better one if the bundle size is of concern.
Using the website
The website gives two major functionalities:
Inspecting a plugin
-
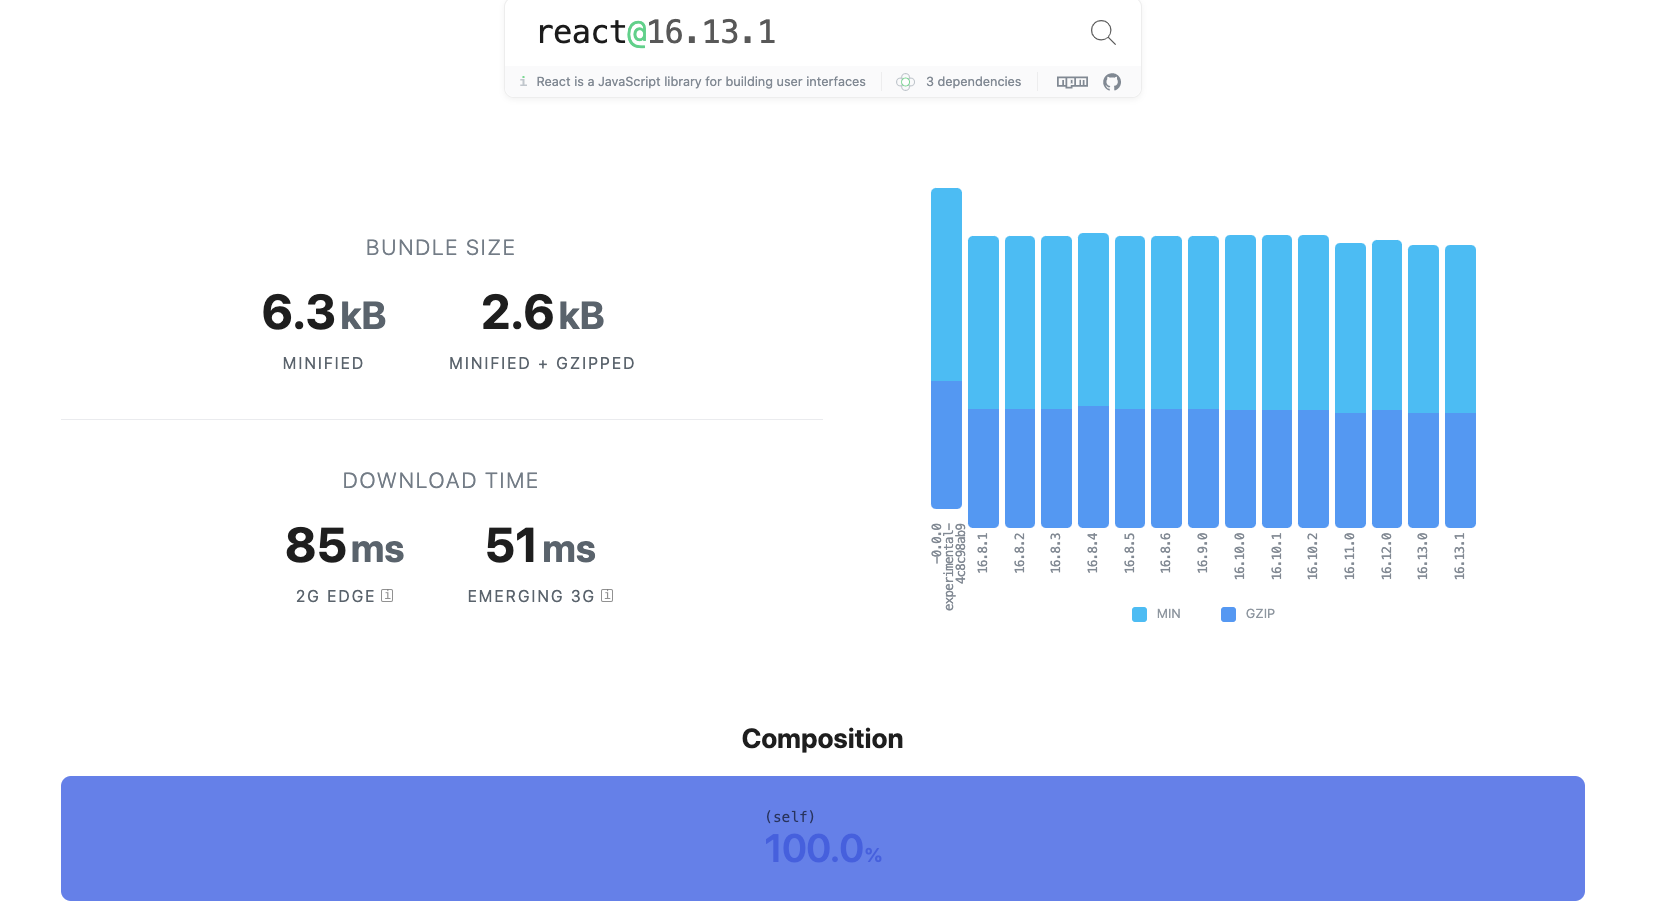
We can find a plugin on the website, and it gives us some useful data like size, download time, dependency information etc.
-
It also provides the size information about different versions of the plugin in a minimal bar graph format.
 Bundlephobia plugin information
Inspecting a bundle
-
This is a beta functionality where we can scan a
package.jsonfile to analyze our bundle. -
The web-app then scans the file and lists all the packages that we want to scan.
-
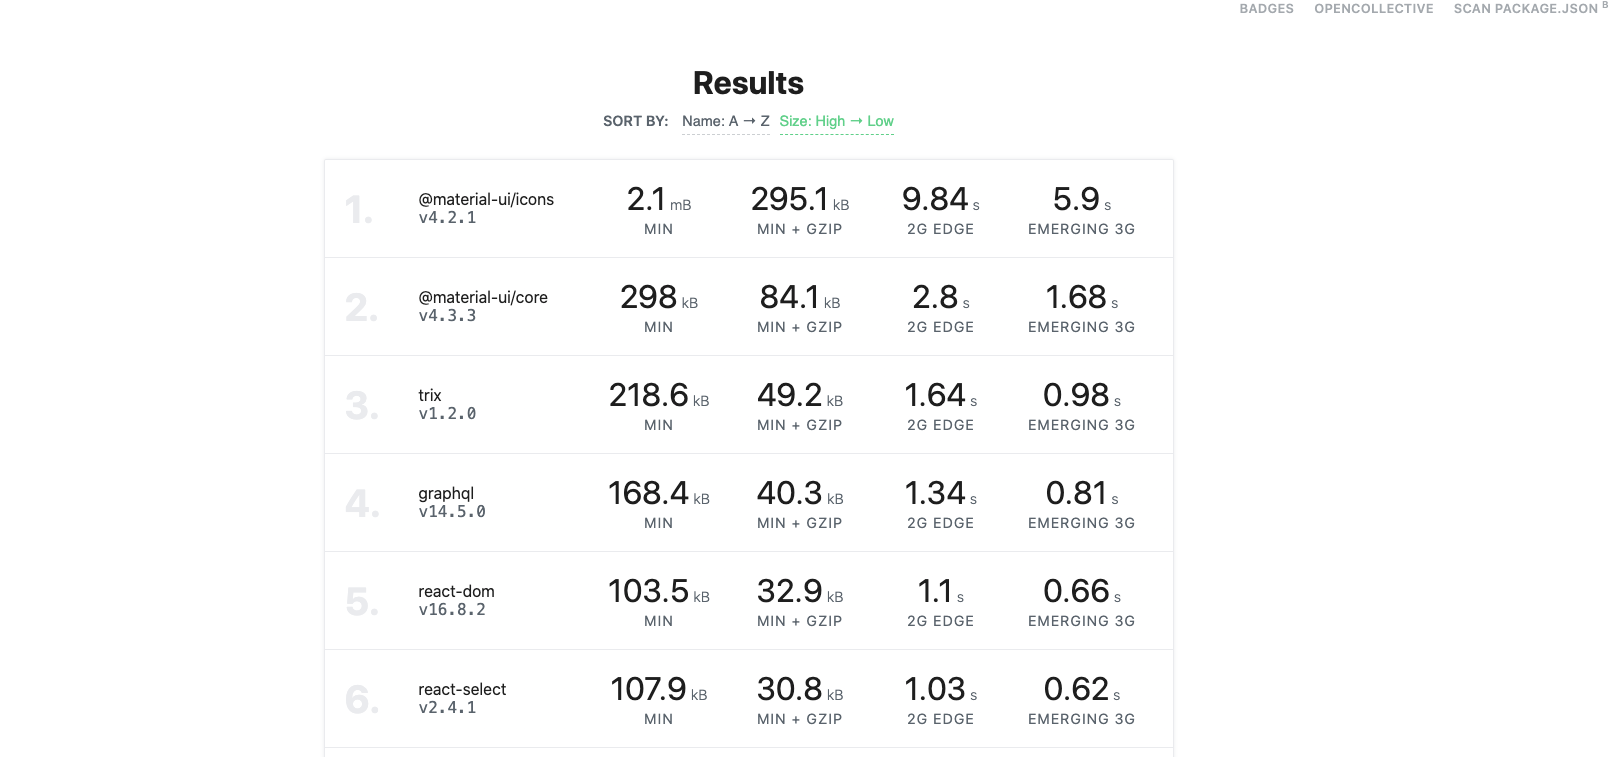
The result is a list of all the scanned packages along with data like
minsize,min+gzipsize, download time on 2G Edge and 3G. -
We can also sort the list in order of their size which helps in highlighting the usual culprits in making the bundle size bigger.
 Bundlephobia bundle information
Summary
We looked at different tools that we can start using to inspect and analyze our current webpack bundle size. We also looked at a web application that allows us to delve deeper into an individual package before adding it to our bundle.
