In our last blog Scalability Testing using k6, we discussed the importance and use of scalability testing. We also discussed how to create a User Profile for our application and design our test strategy accordingly. In this article, we will do a comparison of the performance metrics from when we started VS the improved performance of our APIs at the end of our scaling process.

Image showing p95 values for all tests run on k6 cloud dashboard.
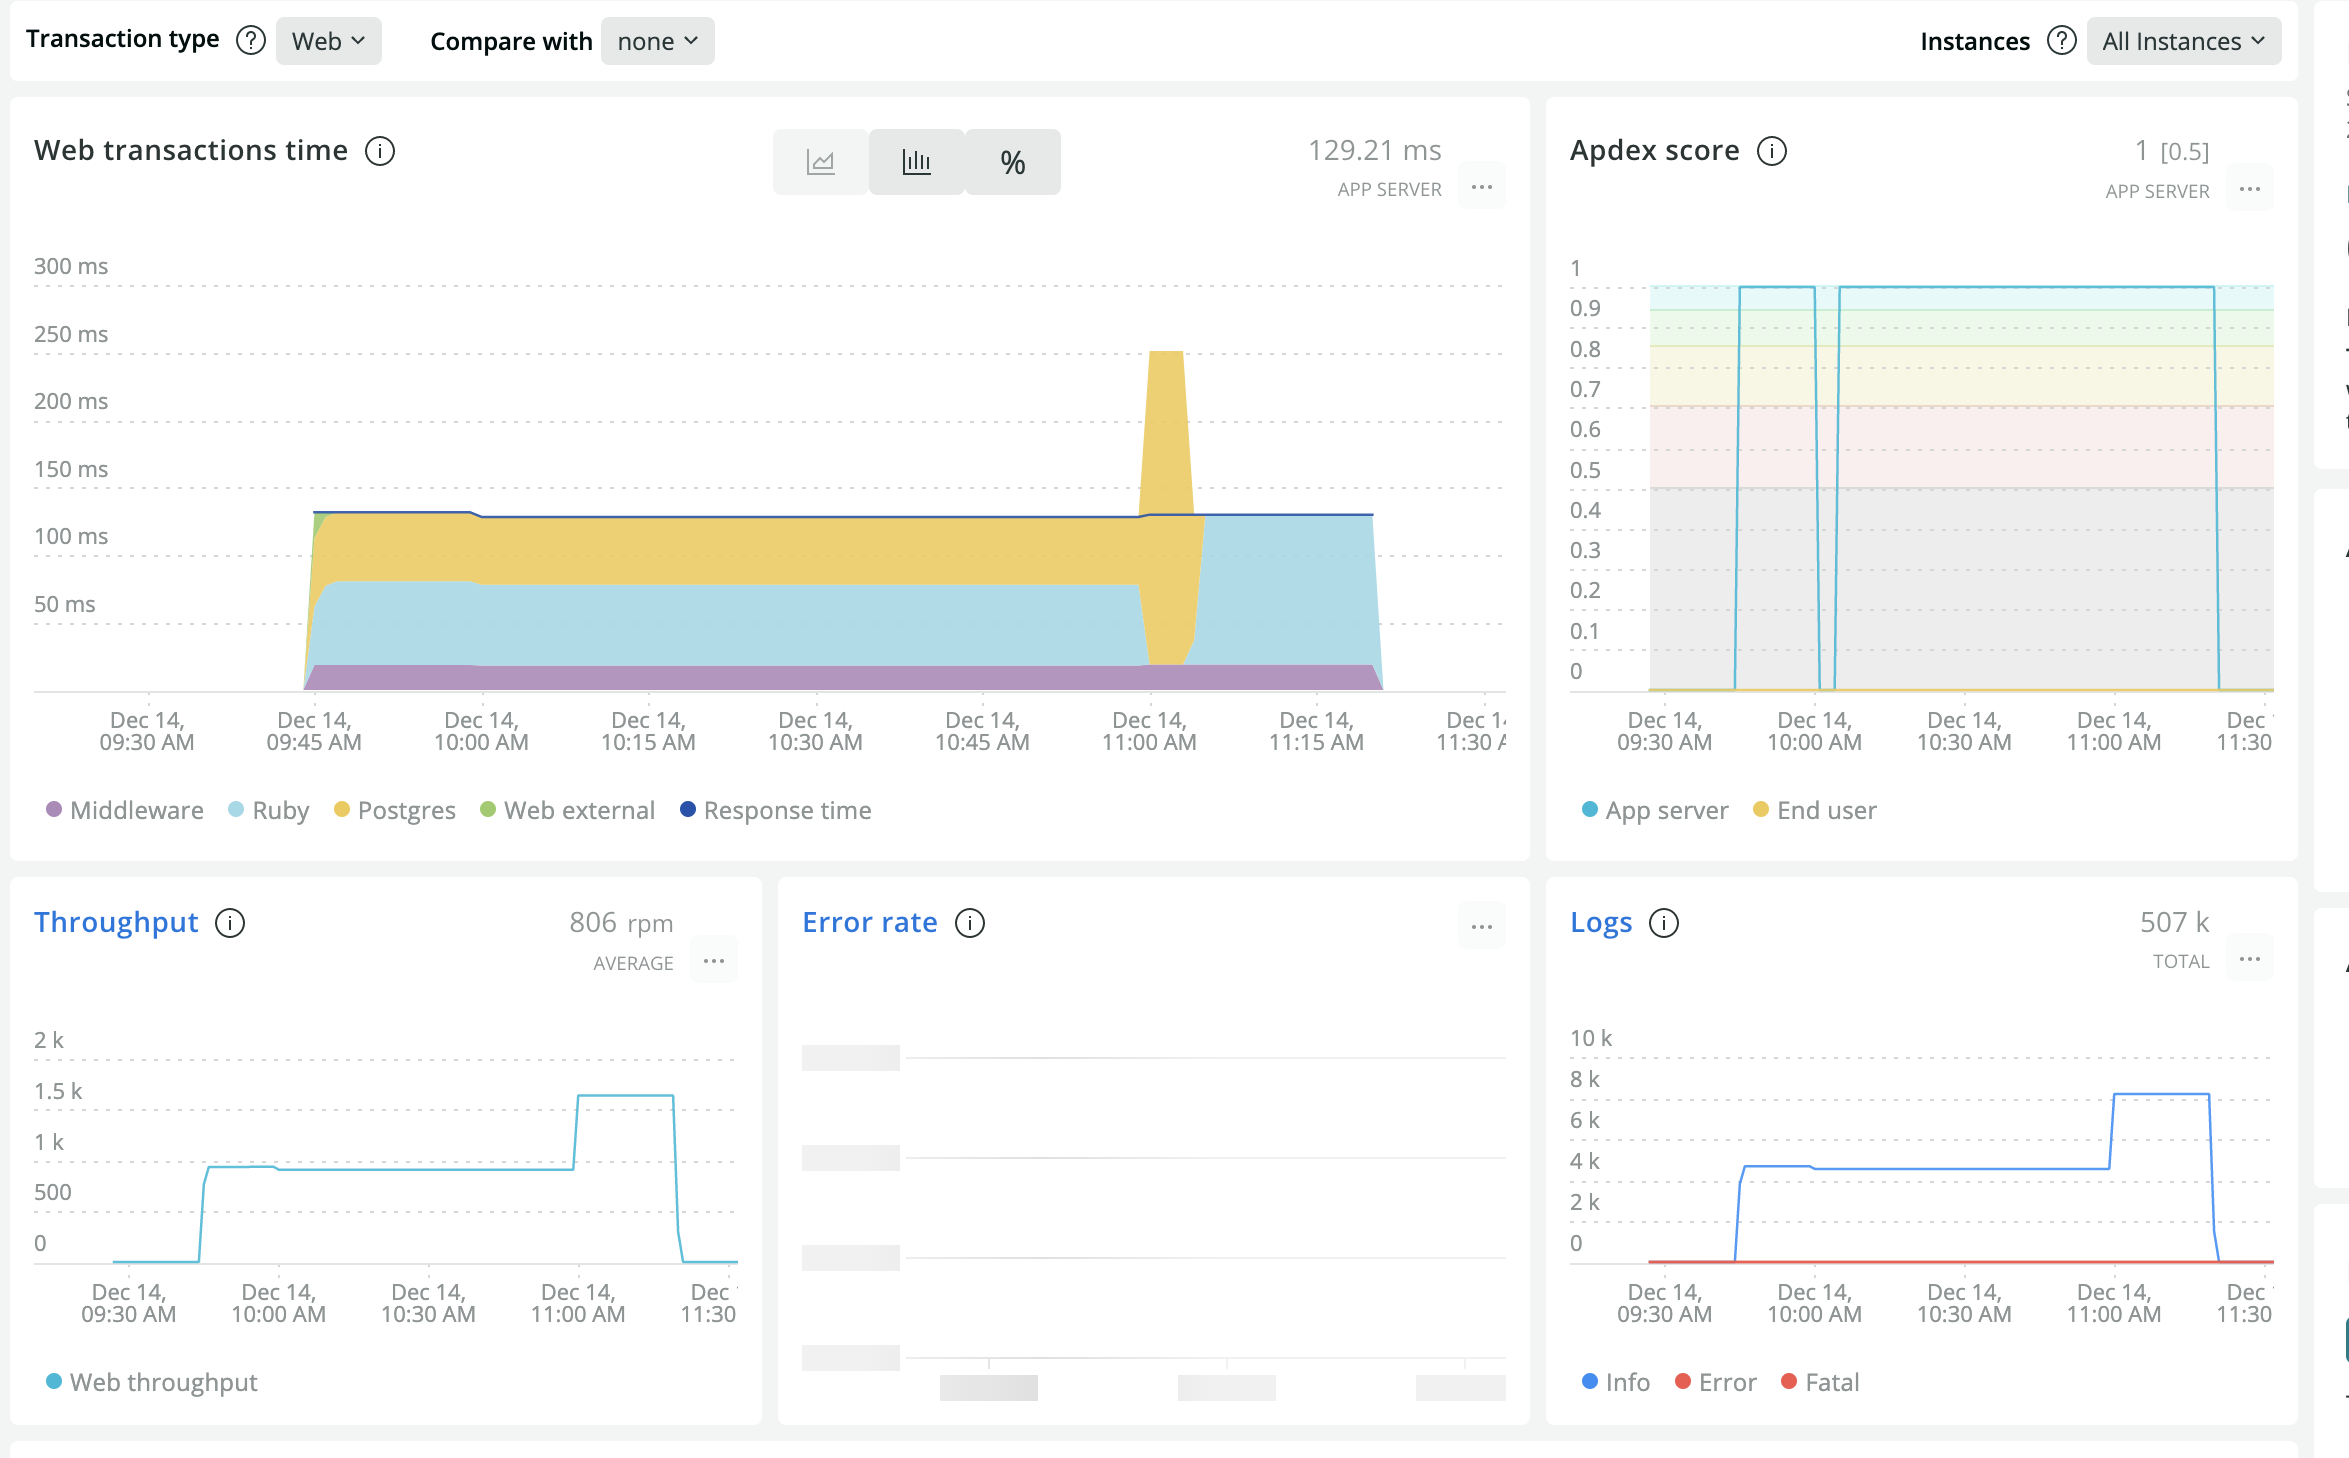
Performance when we started.
We defined our user profile and identified three scenarios as mentioned below:
- The first one is where all API calls {1, 2, 3, 4 & 5} are made separately. Total = 265 calls
- Second(with bundling), where API {2, 3, and 4} are bundled in 1 request ‘per call’ to API 1. Total= 140 calls.
- Third(with batching), where API {2, 3, and 4} are bundled in 1 request ‘per 10 calls’ to API 1. Total = 28 calls.
From the implementation perspective, we already had Pagination in place for our main ‘API 1’.
We used k6 cloud for running load test scripts and New Relic for checking the backend metrics.
On running multiple experiments for all three scenarios along with Horizontal and Vertical scaling on the Heroku environment (2 x Standard-1x Dynos with WEB CONCURRENCY = 2, RAILS MAX THREADS = 5), we reached the best results(from New Relic) for 50 Virtual Users running for 10 mins for Scenario 2.
Average Response Time: 129ms
P(95): 300ms
Throughput: 806 rpm, 13.4 rps.

Image showing initial New Relic metrics.
Things we did to improve
To scale the system for a large number of users with a seamless user experience, we experimented and implemented the below changes:
-
Moved to AWS from Heroku
- Performance: Using the large dataset that we collected by running the load tests, we found that Heroku dynos did not perform as well as compared to servers on AWS for the same price.
- Autoscaling: In Heroku, this option is available only for performance tier dynos. Since we can do this with Kubernetes, we decided to use that instead.
- Cost: We expect a large number of customers hence decided AWS would be much cheaper.
- Faulty Dynos: Our app was cycled to faulty dynos after auto-restart multiple times. This could create a lot of problems for the users.
-
Wrote Custom Serializer
Some of our API endpoints returned a lot of data. To optimize the rendering we did a few changes:
- We identified and removed partials to reduce the latency.
- We added Oj(Optimized JSON), which improved the response time but it wasn’t enough.
- Finally, we decided to write ‘Custom Serializer’ for all our important API endpoints, which significantly improved the overall performance.
-
Compressed requests
We compressed our API responses with Rack::Deflater which gave us a significant boost on the client-side.
-
Caching
Initially, we were caching the API responses on the mobile, but we ran into issues related to memory consumption and slow startup. To fix it, we changed our approach:
- We now generate a JSON file with API response every 5 minutes.
- Upload the file on AWS S3.
- Compress the file and serve it through CDN(Content Delivery Network).
Improved Metrics
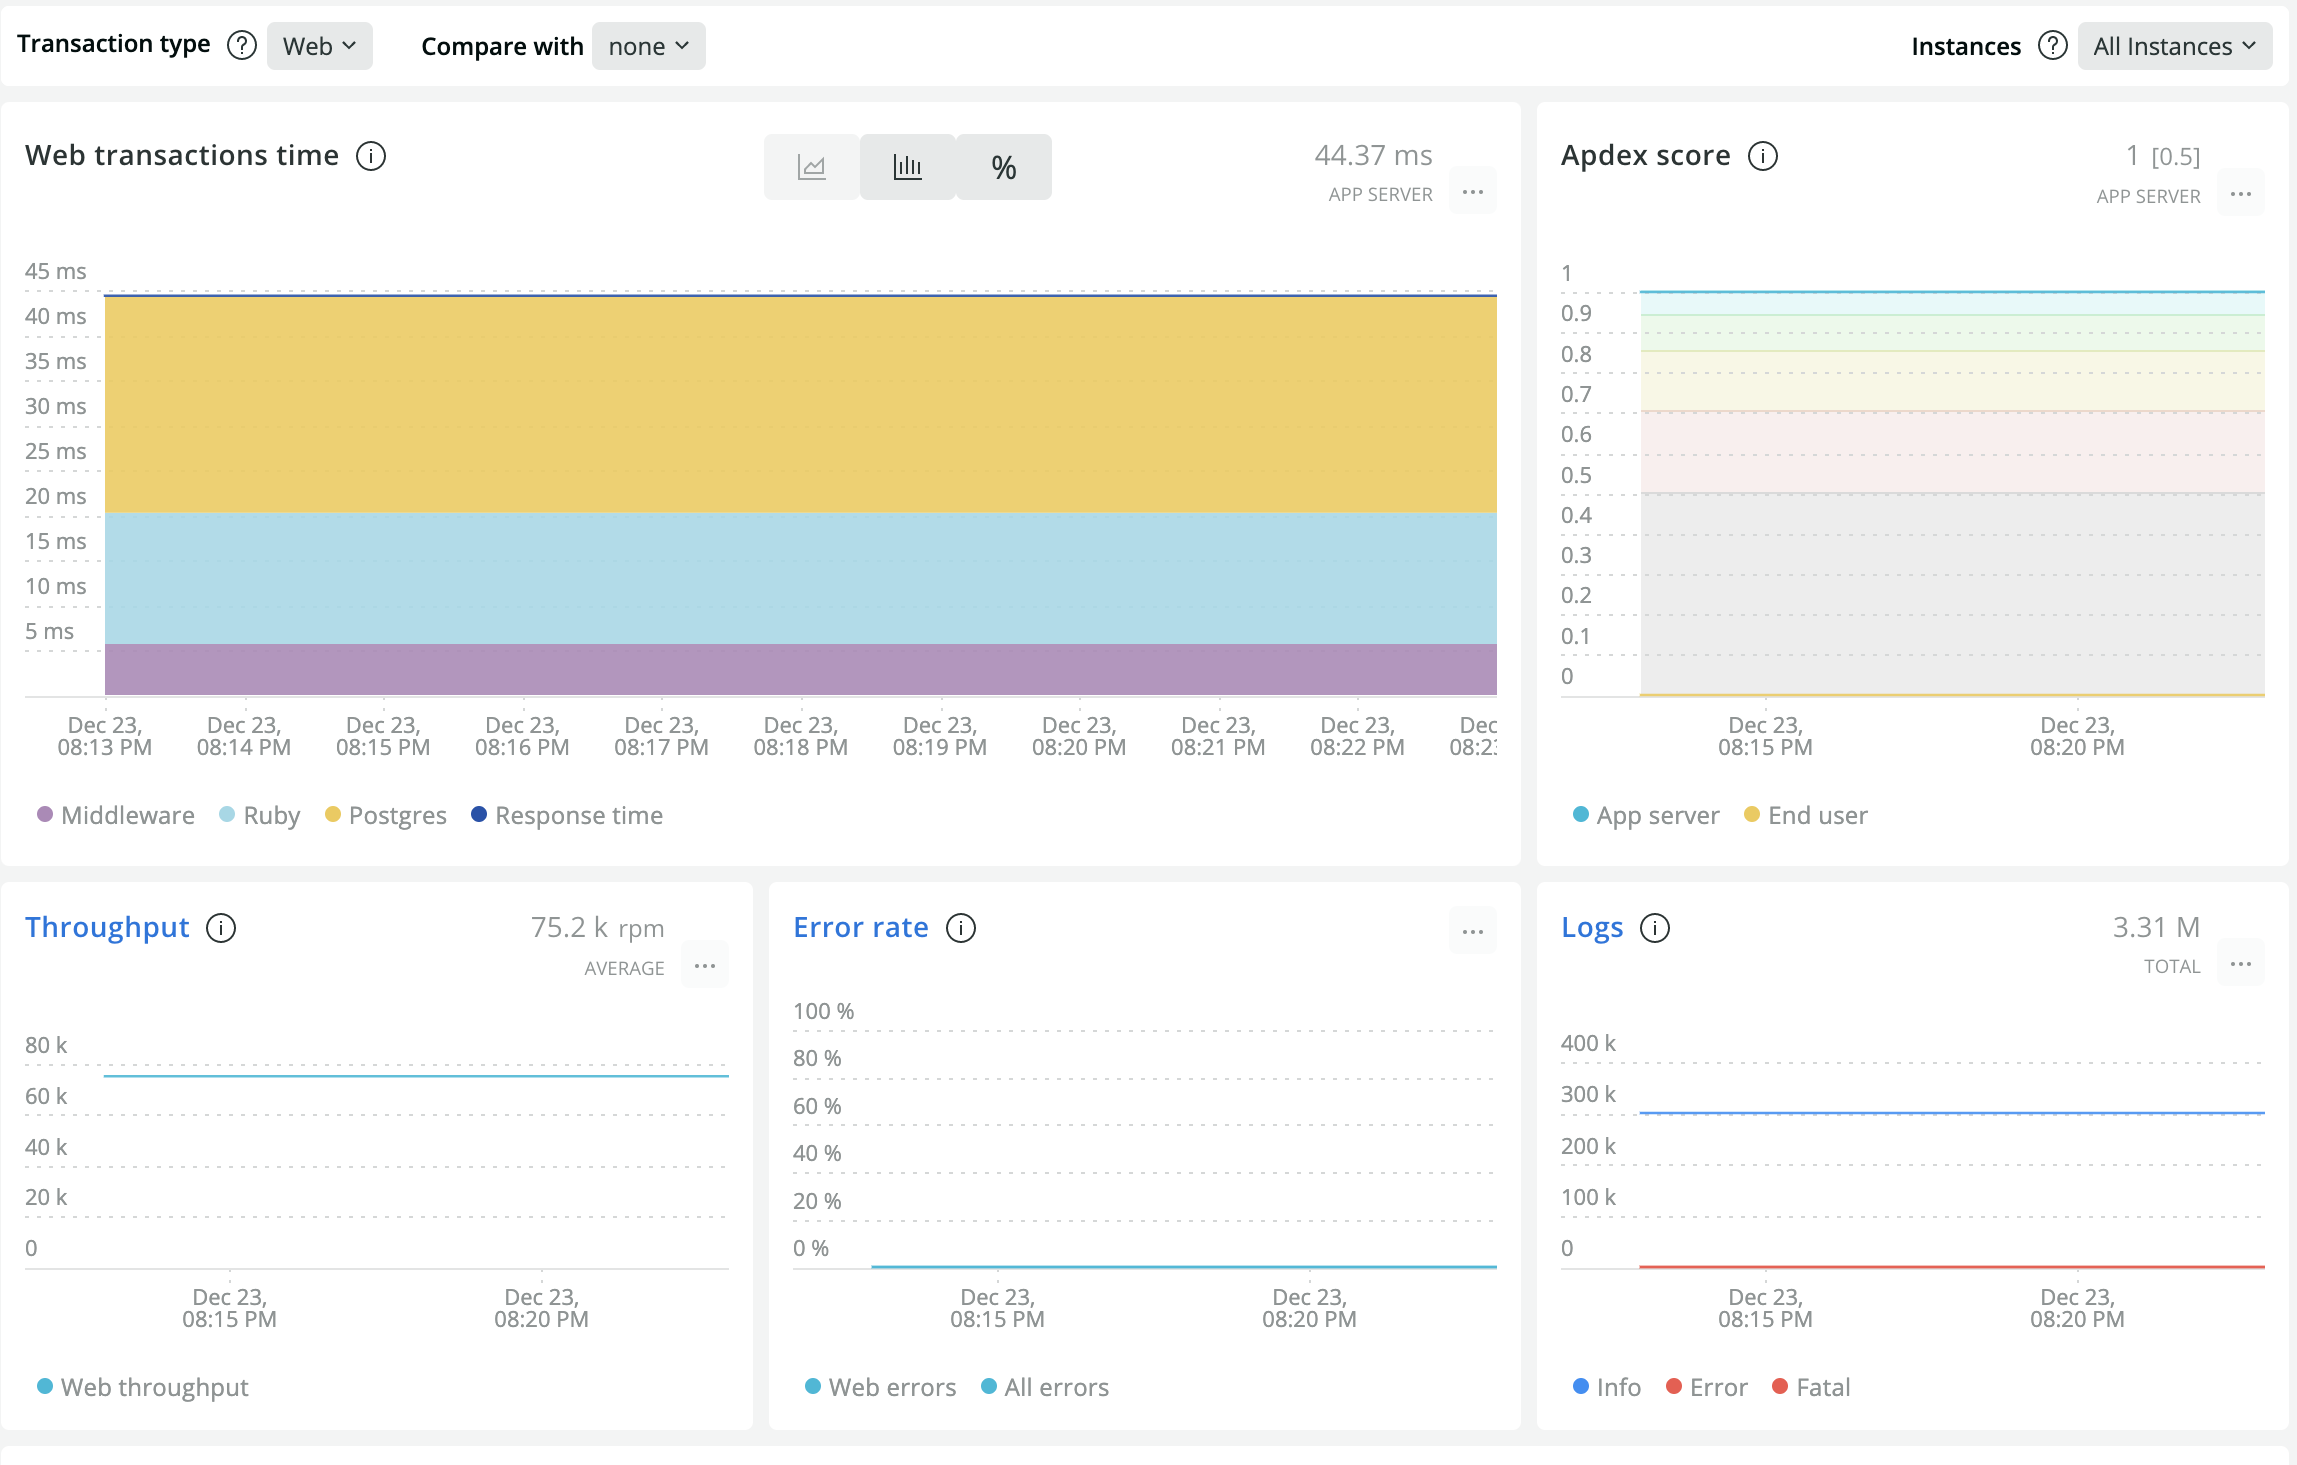
After all the changes, we could run 1000 iterations for each of 1000 Virtual Users for 10 minutes for Scenario 3. on Amazon Elastic Compute Cloud (Amazon EC2) with a config of- 10 Nodes and 75 Containers. At this rate, our system can easily handle up to 100k users. Below were our results:
Average Response Time: 44.37 ms
P(95): 52 ms
Throughput: 75.2k rpm, 1253.3 rps

Image showing improved New Relic metrics.
Key Points
k6 vs New Relic: We need to keep in mind that platforms like k6 give us the total time taken by a request to complete whereas New Relic gives us the metrics of the server. Hence, there will always be a difference in the ‘average response time’. Also, New Relic gives us details of the system performance like throughput and CPU utilization. These metrics are essential according to which we can take the architectural decisions.
Application requirements: Before we start laying out the scale plan, it’s important that we keep a few things in mind like the expected number of users on the application, budget, geolocation, expected growth rate, etc.
In this article, we tried to give a high-level overview of the approach that worked well for us. Designing a scalable application requires a lot of expertise and planning. So far this approach has given us good overall performance, but as the data increases, we will consider more changes. Hope you found this insightful.
